
© ES-CON JAPAN Ltd.
About Us
Business Plan
Business Plan
Long-Term Vision 2030
Overview of 5th Medium-Term Management Plan
We are currently working on our "Long-Term Vision 2030" which sets out the state we want ES-CON JAPAN to be and the direction we should aim for by fiscal 2030, and our "5th Medium-Term Management Plan" (fiscal year ending March 2025 to fiscal year ending March 2027), which is "Phase I" to achieve this.


The direction we should aim for
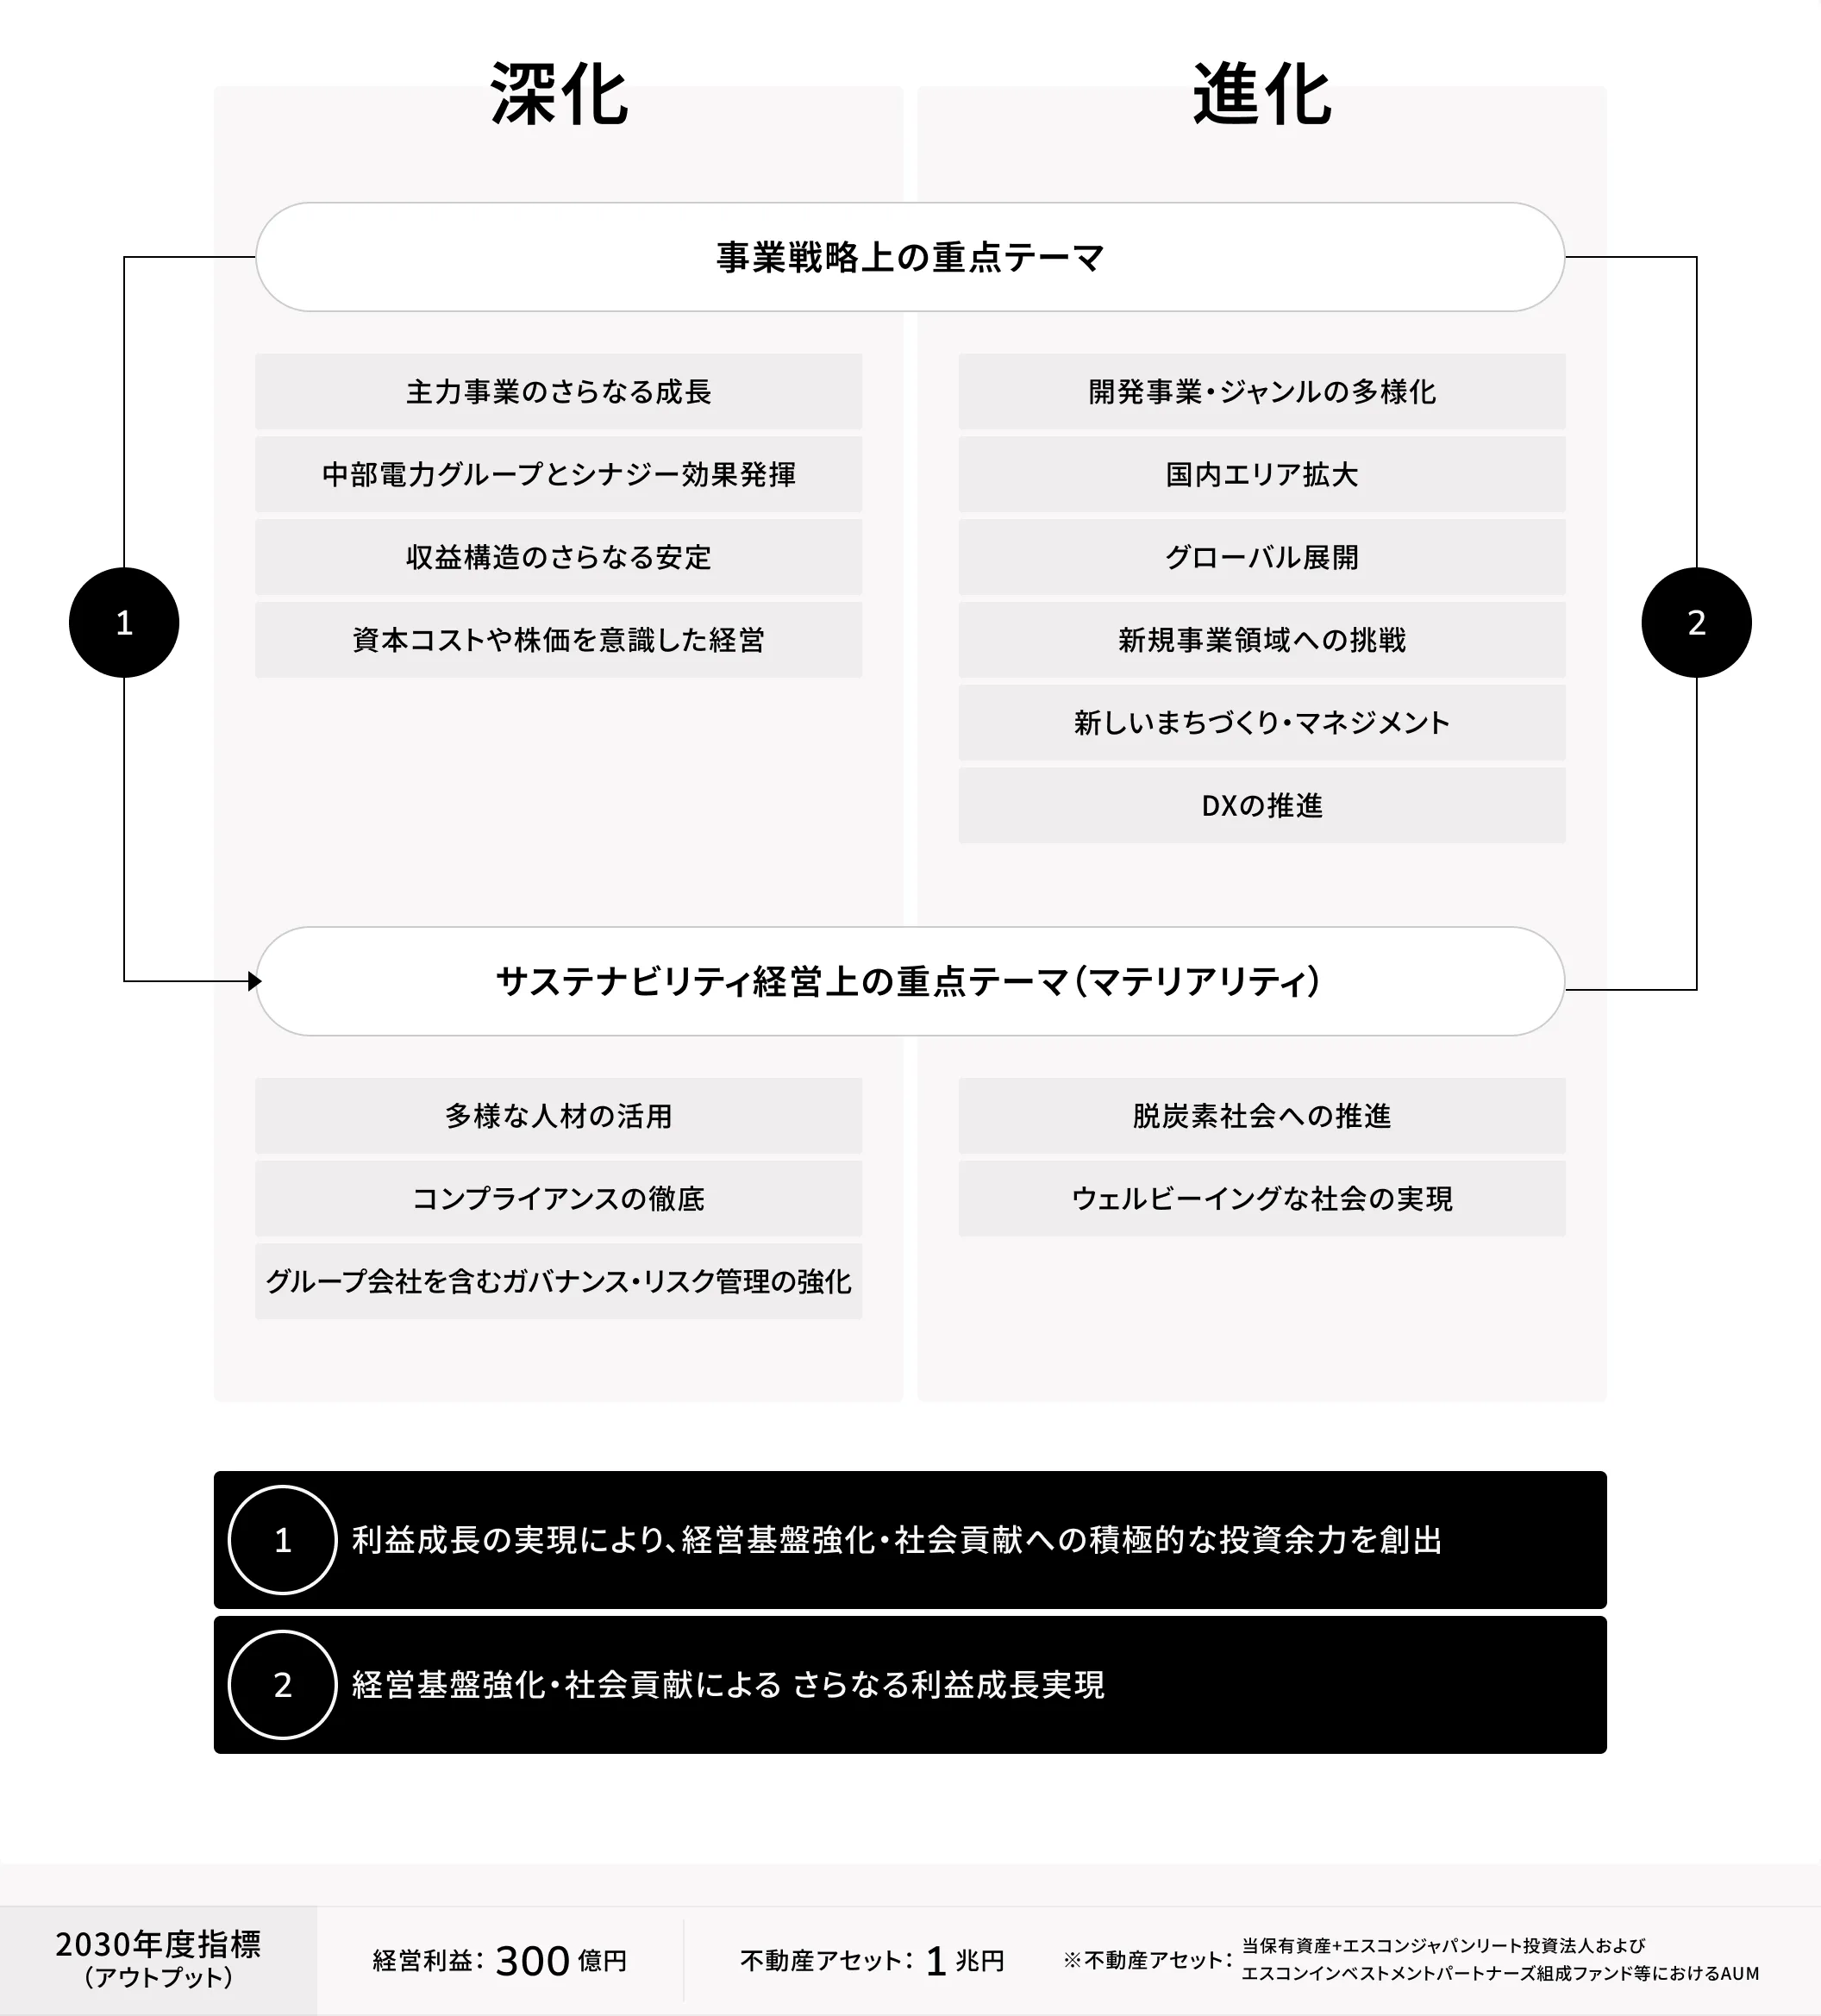
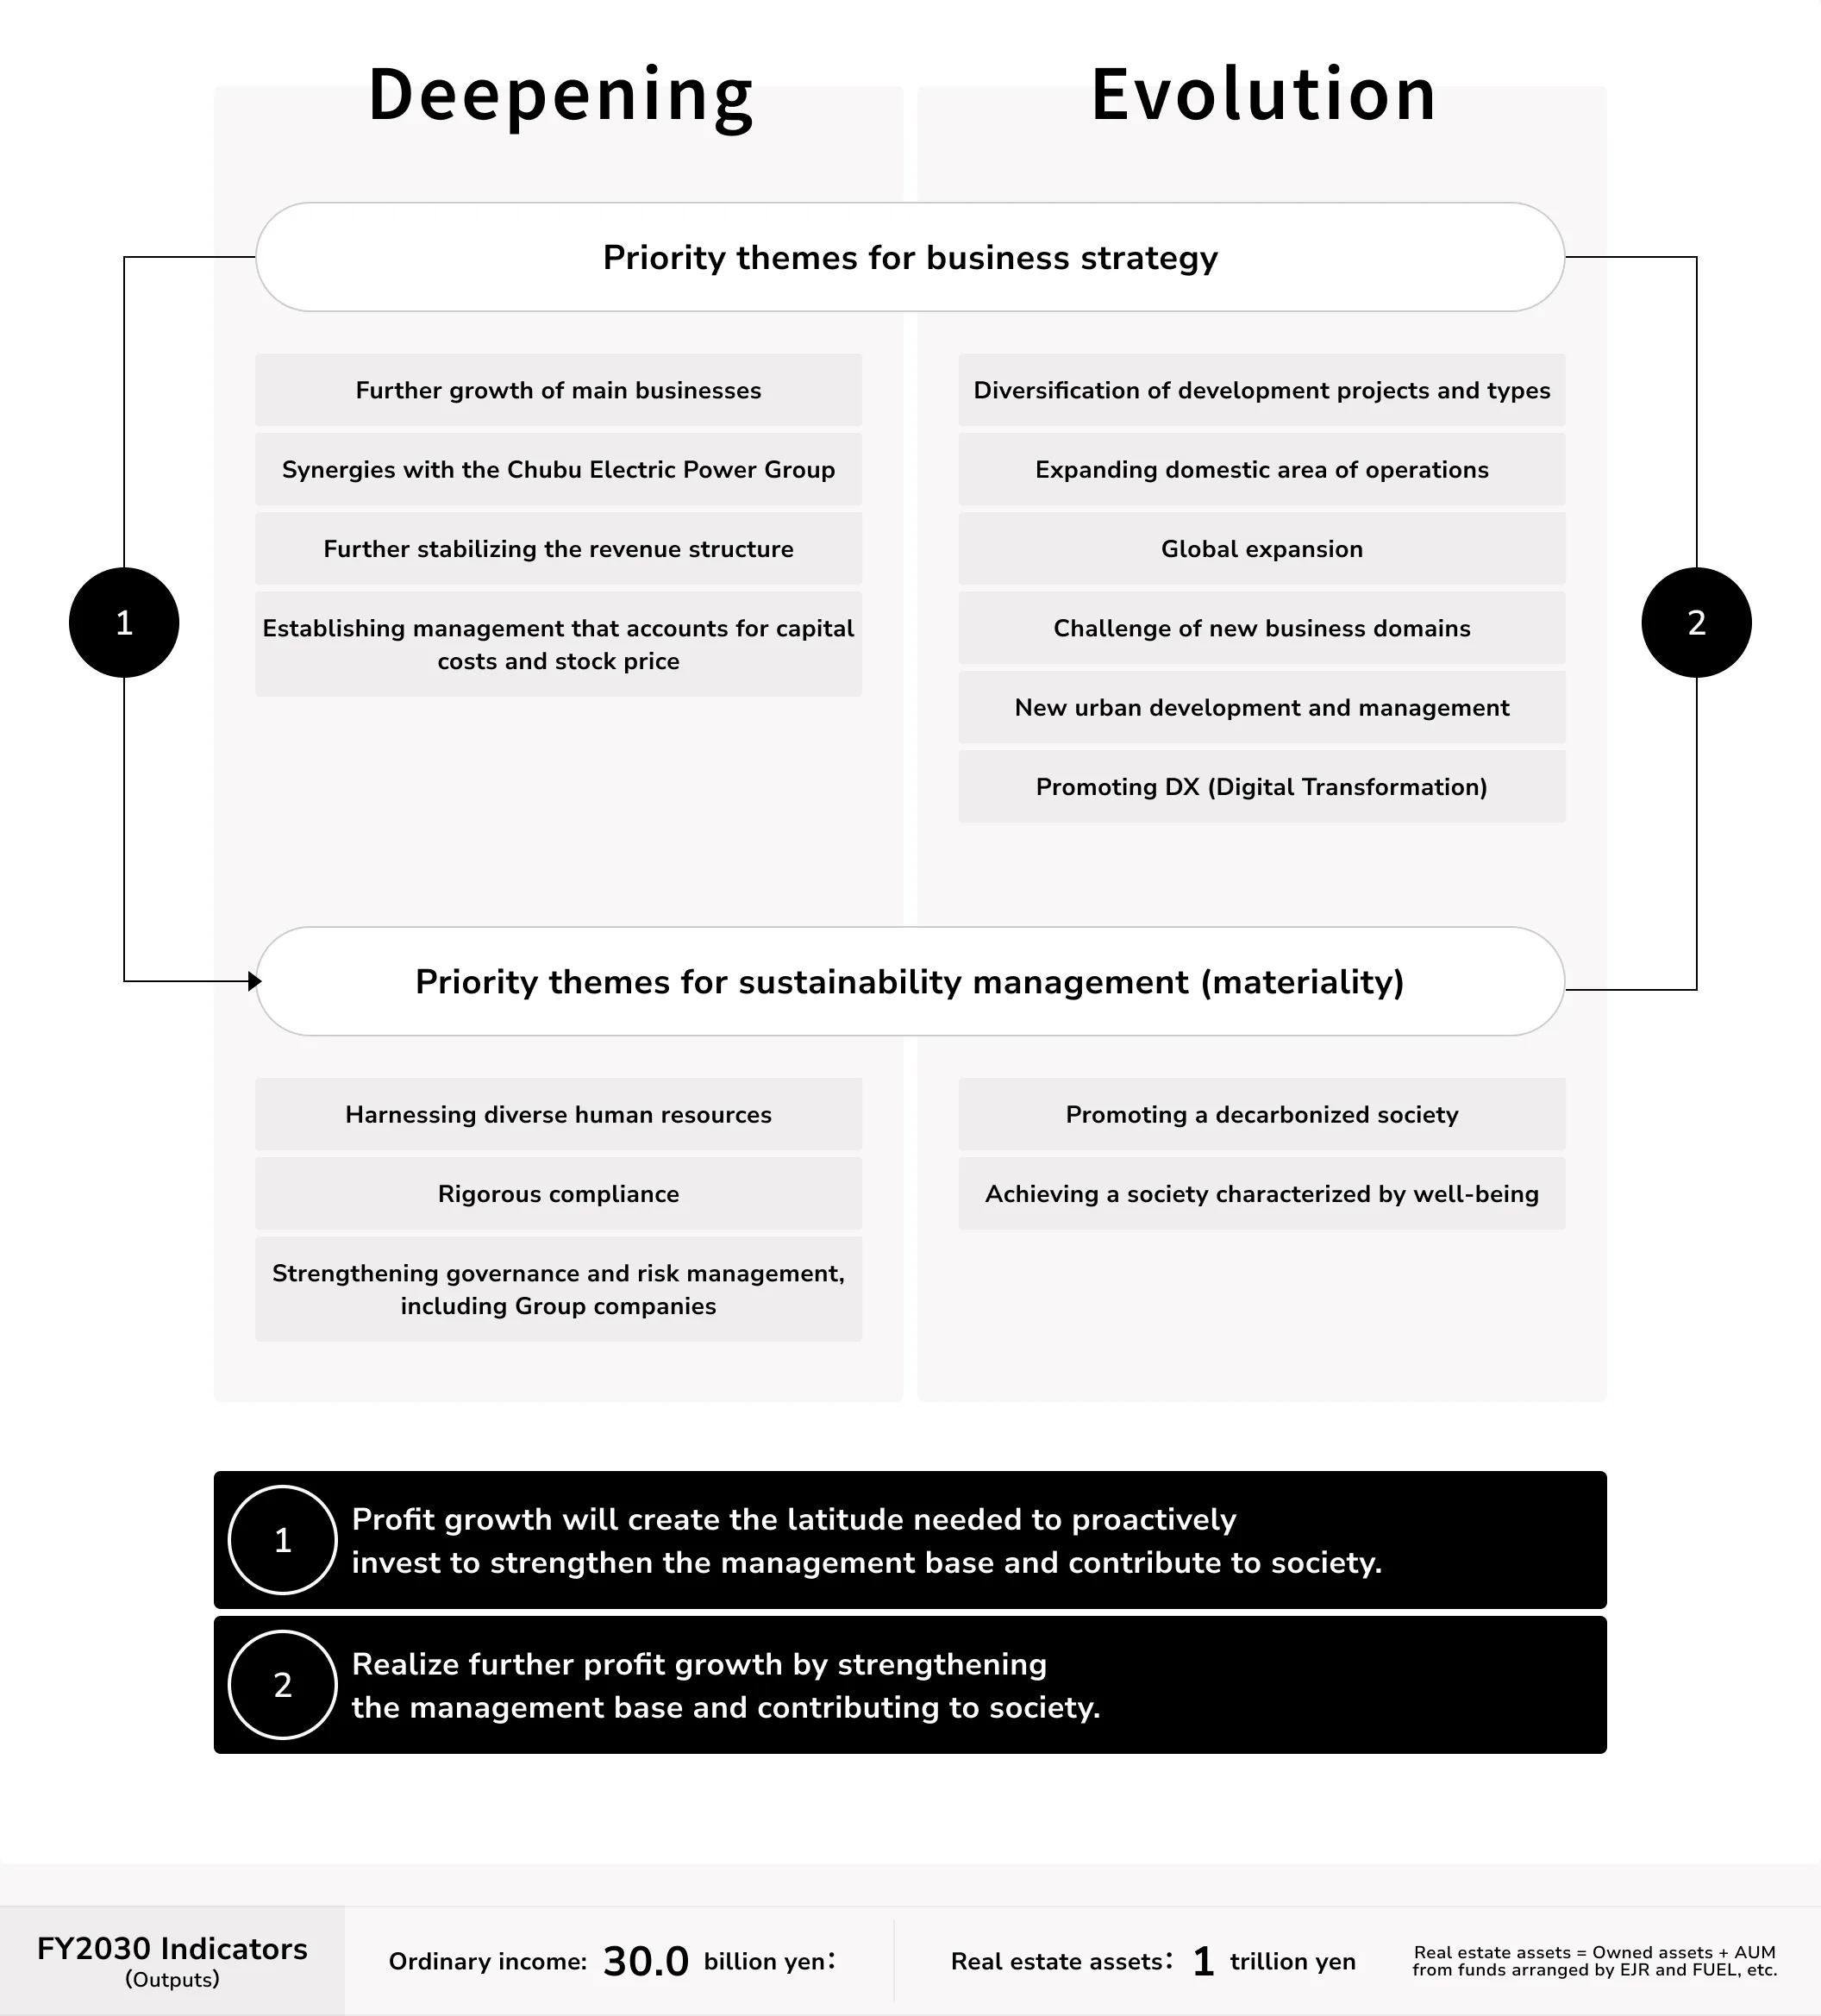
With the themes of "Deepening" and "Evolution" in mind, we will promote management with the aim of achieving further growth in our core businesses and further stabilizing our profit structure, thereby contributing to society and creating a virtuous cycle that will lead to further corporate growth.
Performance Plan
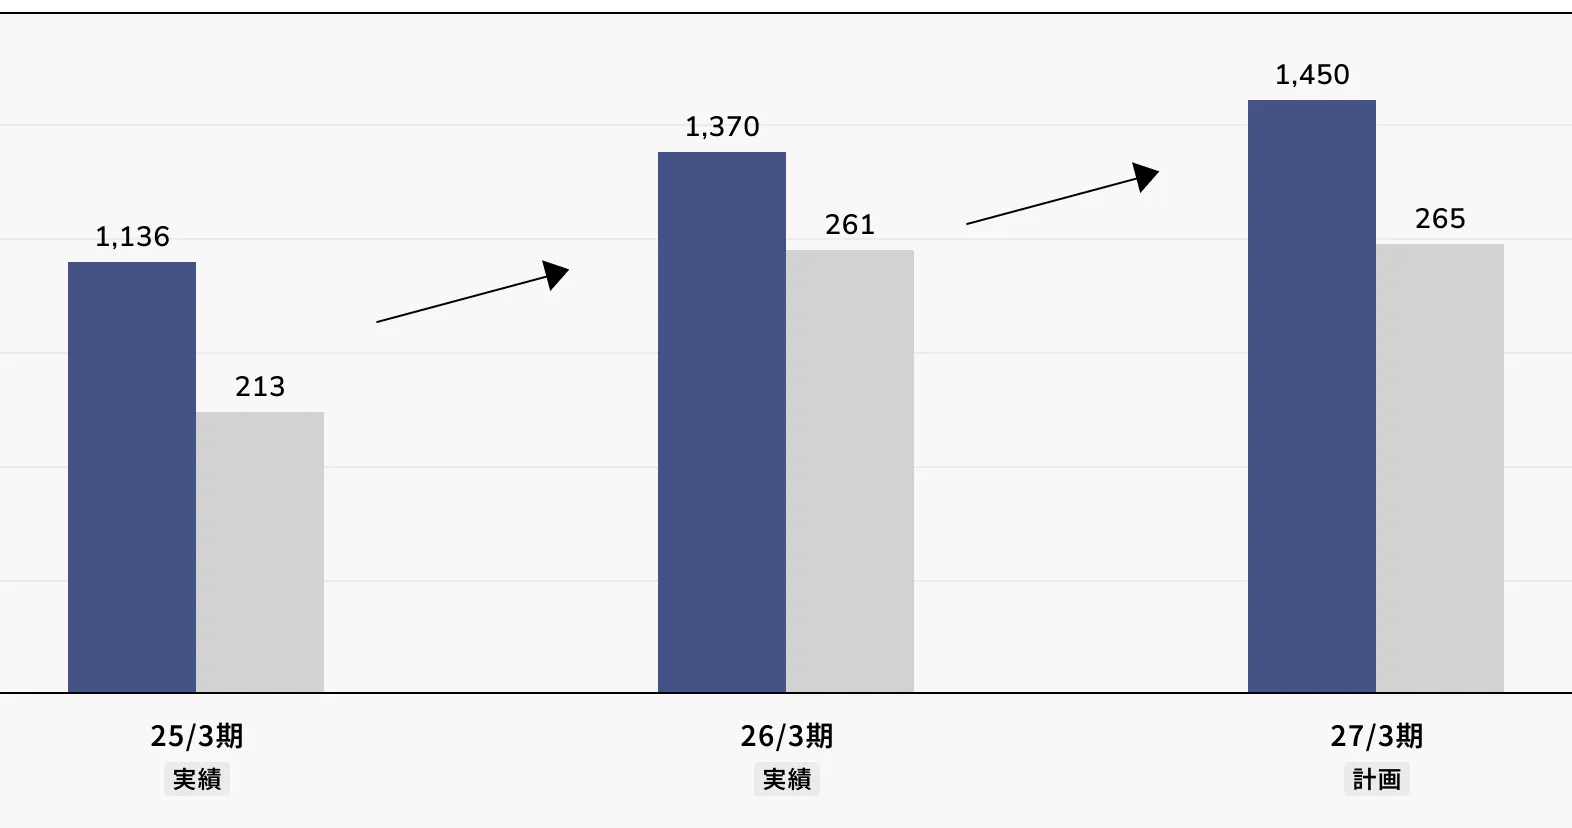
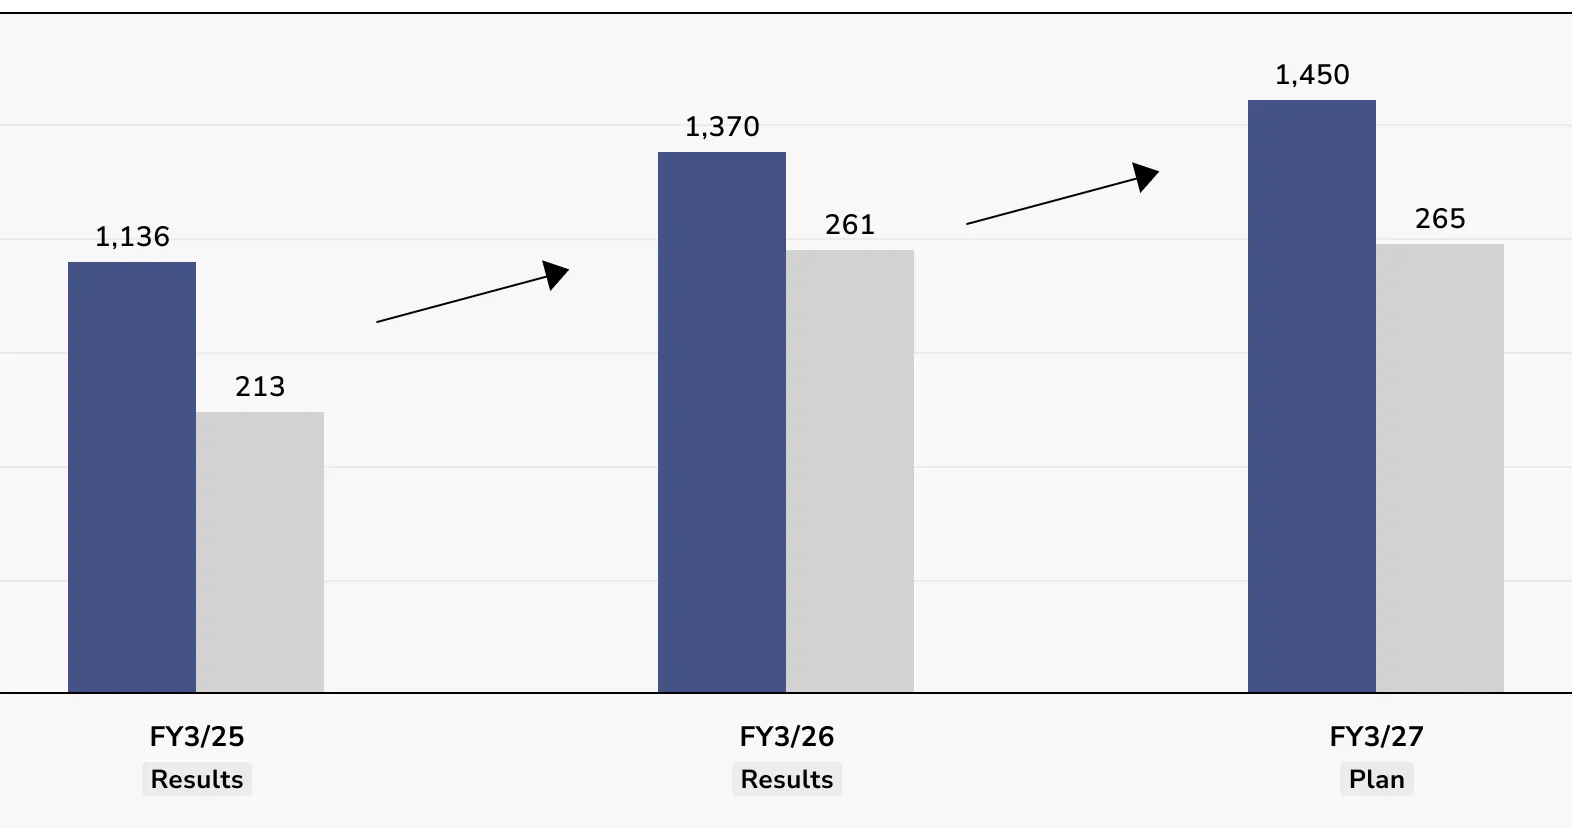
For the fiscal year ending March 2027, the final year of our medium-term management plan, we anticipate exceeding our operating profit target. Our projected operating profit for the final year is 26.5 billion yen (a 6.0% increase compared to the revised plan), against a target of 25 billion yen.
| 24/3期 | 第5次中期経営計画(億円) | ||||
|---|---|---|---|---|---|
| 25/3期 | 26/3期 | 27/3期 | |||
| 実績15ヶ月決算 | 実績 | 実績 | 計画 | ||
| 売上高(億円) | 1,188 | 1,136 | 1,370 | 1,450 | |
| 営業利益(億円) | 190 | 213 | 261 | 265 | |
| 24/3期 | 5th Medium-term Management Plan(Billions of yen) | ||||
|---|---|---|---|---|---|
| 25/3期 | 26/3期 | 27/3期 | |||
| Actual15-mo. FY | Actual | Actual | Plan | ||
| Net sales(Billions of yen) | 1,188 | 1,136 | 1,370 | 1,450 | |
| Operating profit(Billions of yen) | 190 | 213 | 261 | 265 | |
Investment Plan
We are planning business investments to further stabilize our revenue structure in the medium to long term and to cultivate businesses that can become new pillars of our business. As of the beginning of the fiscal year ending March 2027, we have achieved 69% progress (including contracts and provisional agreements) towards our investment targets for the medium-term management plan period.
| 第5次中期経営計画(億円) | ||||
|---|---|---|---|---|
| 25/3期 | 26/3期 | 27/3期 | 3ヵ年 | |
| 実績 | 実績 | 通期計画 | 計画 | |
| グロス投資額 計 | 720 | 547 | 1,230 | 2,500 |
| 分譲マンション開発 | 161 | 161 | 300 | 611 |
| 収益物件開発 | 427 | 143 | 450 | 1,127 |
| 稼働中収益物件取得 | 78 | 204 | 400 | 578 |
| 海外投資 | 54 | 11 | 50 | 174 |
| その他 | 0 | 27 | 30 | 10 |
| 回収額 | 220 | 332 | 405 | 945 |
| 内、収益物件 | 84 | 155 | 287 | 505 |
| ネット投資額 | 499 | 214 | 825 | 1,550 |
| 5th Medium-term Management Plan(Billions of yen) | ||||
|---|---|---|---|---|
| 25/3期 | 26/3期 | 27/3期 | 3 years | |
| Actual | Actual | Plan | Plan | |
| Total gross investment | 720 | 547 | 1,230 | 2,500 |
| Condominium development (for sale) | 161 | 161 | 300 | 611 |
| Income property development | 427 | 143 | 450 | 1,127 |
| Acquisition of operating income properties | 78 | 204 | 400 | 578 |
| Overseas investment | 54 | 11 | 50 | 174 |
| Other | 0 | 27 | 30 | 10 |
| Recoveries | 220 | 332 | 405 | 945 |
| Of which: income properties | 84 | 155 | 287 | 505 |
| Net investment | 499 | 214 | 825 | 1,550 |
Management Indicators
We are committed to promoting management that takes into account capital costs and stock prices, and to improving shareholder and corporate value.
| 24/3期 | 25/3期 | 26/3期 | 27/3期 | |||
|---|---|---|---|---|---|---|
| 実績 | 実績 | 実績 | 計画 | |||
| 安全性 | ストック収益割合※1※2 | 25.0% | 26.2% | 25.6% | 30.0% | |
| ストック収益割合/一般管理費カバー率(キャッシュベース)※3 | 112.0% | 115.2% | 119.1% | 116.8% | ||
| 自己資本比率 | 18.1% | 17.2% | 17.0% | 17.5% | ||
| 資本 効率性 | ROE | 14.5% | 14.8% | 14.7% | 14.0% | |
| ROIC※4 | 4.5% | 3.5% | 3.2% | 3.6% | ||
| 24/3期 | 25/3期 | 26/3期 | 27/3期 | |||
|---|---|---|---|---|---|---|
| Actual | Actual | Actual | Plan | |||
| Safety | Stock earnings ratio※1※2 | 25.0% | 26.2% | 25.6% | 30.0% | |
| Stock earnings ratio /G&A coverage (cash basis)※3 | 112.0% | 115.2% | 119.1% | 116.8% | ||
| Equity ratio | 18.1% | 17.2% | 17.0% | 17.5% | ||
| Capital efficiency | ROE | 14.5% | 14.8% | 14.7% | 14.0% | |
| ROIC※4 | 4.5% | 3.5% | 3.2% | 3.6% | ||
※1Stock revenue: Real estate segment profits + asset management segment profits
※2Recurring revenue ratio: Recurring revenue / Total segment profit
※3Stock revenue/general and administrative expenses coverage ratio: (stock revenue + depreciation expenses in the real estate rental segment + amortization of goodwill in the real estate rental segment) / (general and administrative expenses - depreciation expenses in general and administrative expenses - total amortization of goodwill)
※4ROIC: (Consolidated ordinary profit + interest paid - corporate tax, etc.) / (Average of "interest-bearing liabilities + net assets" at the beginning and end of the period)
Dividend Policy
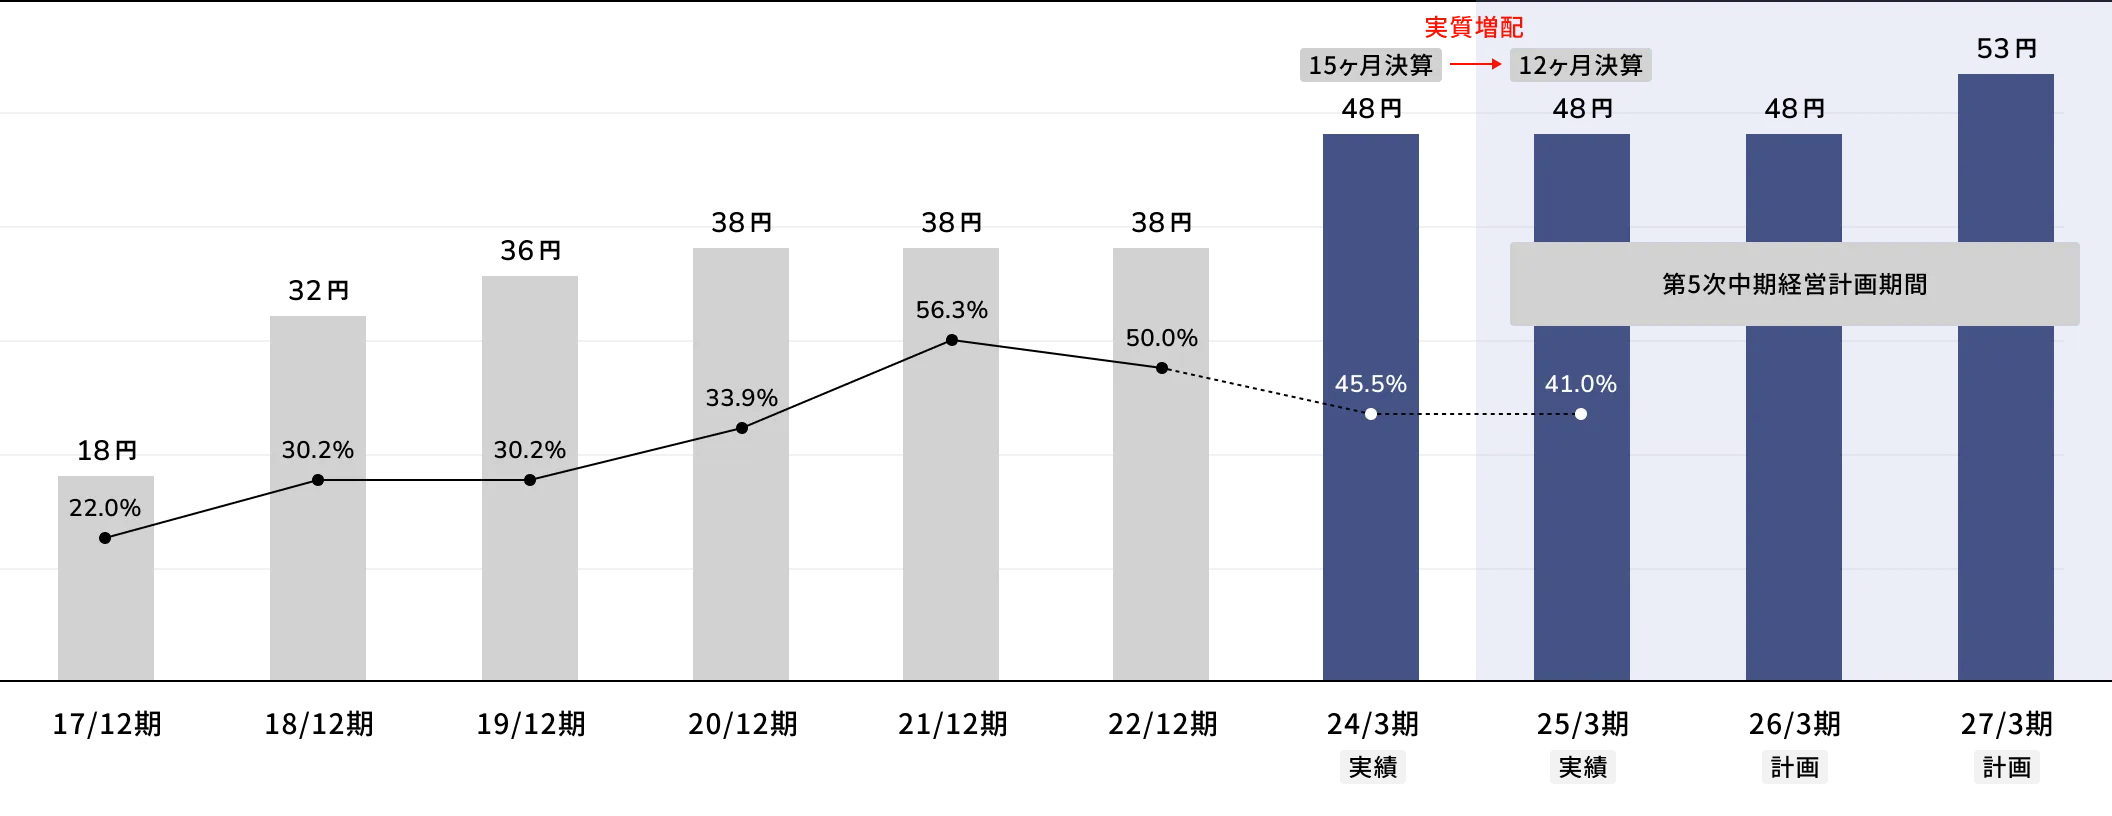
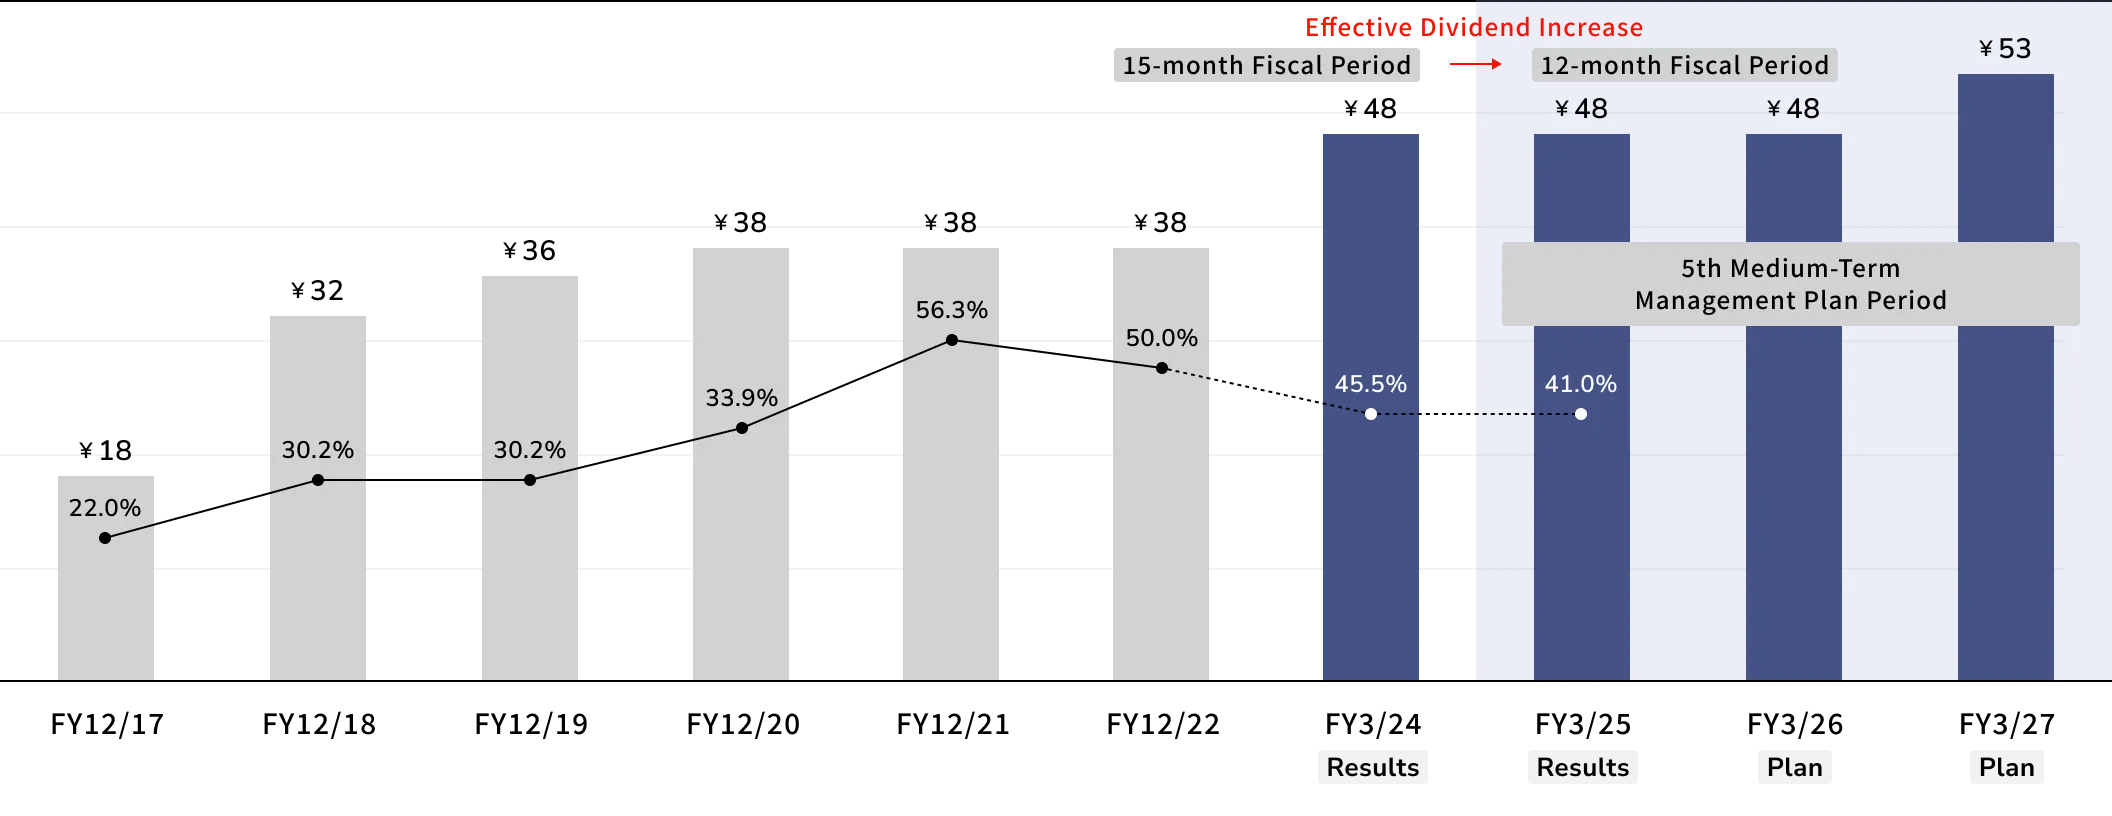
Starting with the Second Medium-Term Business Plan, we have adopted a dividend policy (Progressive Dividend Policy) that sets the minimum dividend per share (DPS) at the previous fiscal year's DPS and, in principle, "will not reduce dividends; will only maintain or increase dividends."